Here at Reconnix, we like to celebrate the achievements of our staff members, from achievements with Docker to Puppet, and beyond. Now there’s another. This time it’s with Zabbix.
 Chris Davidson is the Operations Technical Lead at Reconnix, and a bit of a whiz when it comes to Zabbix.
For those of you that don’t know, Zabbix is an OpenSource monitoring solution for networks and applications. It is designed to monitor and track the status of various network services, servers, and other network hardware.
Chris wrote a blog post about low-level discovery with Zabbix. Well, it turns out that the Zabbix team were impressed with Chris’s blog post and tweeted about it. That’s great news!
With Chris’s permission, we have the blog post here for you to read. Enjoy!
Using Zabbix Low-level discovery to monitor services automagically.
Zabbix is our monitoring tool of choice at work, I feel that it’s a great monitoring platform, and if set-up correctly then it can be a really powerful tool, like any monitoring system though, getting it set-up correctly is the key part. Constantly ensuring that your thresholds are correct. I’ve been investigating ways to do the monitoring we do in a smarter way, mainly trying to take as much possibility of human-error out of the system, and trying to eliminate the deviations that need to be made from the standard templates we use.
In this post (which will hopefully be the first of a few on Zabbix) I’m going to talk about Low-level discovery, which; “provides a way to automatically create items, triggers, and graphs for different entities on a computer.”. The default low-level discovery templates that come with the latest stable version of Zabbix (2.4) allows Zabbix to automatically discover both the connected network interfaces and monitor bandwidth utilisation on those as well as discover mounted disks/partitions and monitor disk utilisation.
Both of these examples are really useful, if somebody creates a new non-standard partition on a machine, previously they would have needed to make sure that it was monitored by Zabbix, duplicating an item and trigger for another partition, what if they forgot? Then you’d have partitions not monitored, potentially filling up and corrupting data or stopping services from running. LLD takes away that element, so as you can see, why wouldn’t you use it. The default templates are great, but there’s not much else out there (aside from this great post about monitoring SSL certificates) with regards to extending the capabilities of LLD. This is where I needed to dig a bit deeper and get something set-up for myself.
The first and most important thing for us is that we are monitoring all of the services that should be running on our servers, we’re doing this using the proc.num item parameters, which checks for any processes matching the pattern you provide, so it was time to have these checks discover themselves.
The first part of LLD is having the server generate the items that it needs to monitor, and LLD works on the back of JSON being outputted on the monitored server side, so I went about hacking a script together to check for the services I wanted to monitor, which you can see below (I’m fully aware my BASH scripting isn’t great but it’s end results that matter, not script elegance ;))…
1 #!/bin/bash
2
3 while getopts "s:" severity; do
4   case $severity in
5     s)
6       SEVERITY=$OPTARG
7       ;;
8    \?)
9       echo "Invalid option: -$OPTARG." >&2
10       exit
11      ;;
12   esac
13 done
14
15 noncrittmpfile=/tmp/rx_noncrit_autodiscovery_tmpfile.rx
16 crittmpfile=/tmp/rx_crit_autodiscovery_tmpfile.rx
17
18 critservices='nginx
19               httpd
20               tomcat
21               php-fpm
22               mysqld'
23
24 noncritservices='ntpd
25                  puppet
26                  cron
27                  sshd'
28
29   echo "{" >> $noncrittmpfile
30   echo "\"data\":[" >> $noncrittmpfile
31
32   echo "{" >> $crittmpfile
33   echo "\"data\":[" >> $crittmpfile
34
35 function critidentify() {
36   process=`ps fax | grep -i $1 | grep -v grep`
37   if [ $? -eq 0 ]
38   then
39   echo -e "{ \""\{#SERVICENAMECRIT\}"\" : \""$1"\"" },
40   else
41   echo "" > /dev/null
42   fi
43   }
44
45 function noncritidentify() {
46   process=`ps fax | grep -i $1 | grep -v grep`
47   if [ $? -eq 0 ]
48   then
49   echo -e "{ \""\{#SERVICENAMENCRIT\}"\" : \""$1"\"" },
50   else
51   echo "" > /dev/null
52   fi
53   }
54
55 for i in $critservices; do critidentify $i; done >> $crittmpfile
56 for i in $noncritservices; do noncritidentify $i; done >> $noncrittmpfile
57
58 sed -i '$s/,$//' $crittmpfile
59 sed -i '$s/,$//' $noncrittmpfile
60
61 echo "]" >> $crittmpfile
62 echo "}" >> $crittmpfile
63
64 echo "]" >> $noncrittmpfile
65 echo "}" >> $noncrittmpfile
66
67
68 if [ $SEVERITY == "critical" ]
69   then
70     cat $crittmpfile
71 fi
72   if [ $SEVERITY == "ncritical" ]
73     then
74 cat $noncrittmpfile
75   fi
76
77 rm $crittmpfile
78 rm $noncrittmpfile
I’ve truncated the script above a little with the services that it’s checking for, as to not give away too many secrets :P.
So for those who can muddle their way through that script it should be fairly self-explanatory, if not then here’s a quick rundown, it takes one argument “-c” (criticallity), which tells it whether to output services that are critical, or not critical (for the different severities in Zabbix, I’ll come back to this later on). Here’s some example output, of critical services, for the rest of this post I’ll focus on the critical services;
1 [root@test-server ~]# /usr/local/bin/zbx_servdisc.sh -scritical
2 {
3 "data":[
4 { "{#SERVICENAMECRIT}" : "nginx" },
5 { "{#SERVICENAMECRIT}" : "php-fpm" },
6 { "{#SERVICENAMECRIT}" : "mysqld" },
7 ]
8 }
My test server has nginx, php-fpm & mysql running on it, great! We’ve now got a script which outputs JSON that Zabbix can read from, now to the Zabbix configuration files & web interface to get things configured.
Firstly, in your /etc/zabbix/zabbix_agentd.d directory deploy the following file;
1 UserParameter=crit.service.disc,/usr/local/bin/zbx_servdisc.sh -scritical
This is telling the Zabbix server the key that will be used for this check, which in this instance I’ve named “crit.service.disc” (this can be anything). Restart the Zabbix agent and that should be the last thing you need to do on the command line, now over to the interface.
Head into Templates and create a new template, I’ve just called mine “Template_Daemon”, then create a discovery rule within that template, below are the settings I’ve got in mine;

There are 3 main fields to worry about; “key” – ensure that this matches what you’ve put in the configuration file above, in my instance “crit.service.disc”, “update interval” – this is how often Zabbix will check the autodiscovery rule, I’ve set this to 30 seconds whilst testing but this can probably be as low as an hour if you’re not adding services often, and finally “keep lost resources period” – this is probably the most important part of this entire configuration, whilst testing I’ve set mine to 0 so as soon as my script reports a service isn’t running then it will stop it from being monitored, when I move this production I’ll be setting this to 7, that will mean any service which autodiscovery thinks is no longer running will flag as down for 7 days before being removed automatically from monitoring, which should be plenty of time for someone to take necessary action.
Now we’ve got that set-up, lets move on to creating the item and trigger prototypes, from the top navigation select item prototypes and then create a new one, and then create one for trigger prototypes, below are my settings for both of these section;
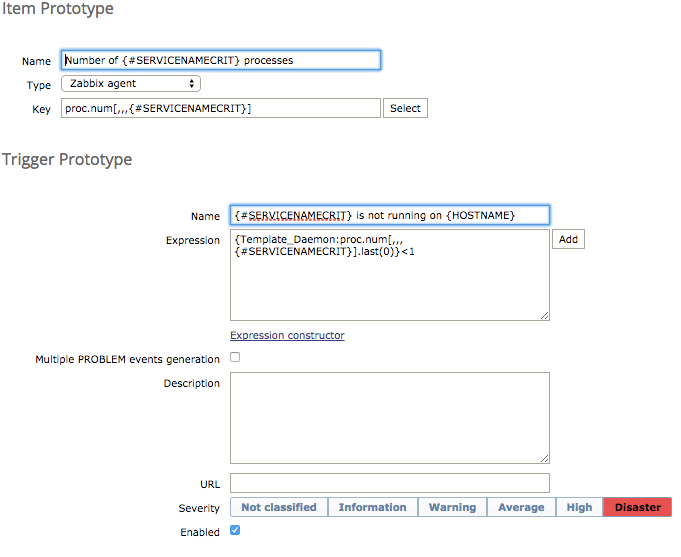
The above screenshots are trimmed but all other settings remained as default. The above settings are pretty self explanatory if you’re familiar with Zabbix, if you’re not then head over to their site and view the items page, which can explain a lot better than I can.
Gotchas
As with all thing, the more you put in the more you get out, and this has been something I’ve been working on inbetween time, so there’s a few key considerations to take away from this monitoring set-up.
- If you’re thinking of using this in production, somebody who knows the system should ensure it is in the state that it should be when adding the autodiscovery of services.
- The BASH script currently hosts the list of services that is being checked for, that needs to be kept up to date on each server, you should probably use an automation tool to do that, OR modify the script so that it reference a central location for the services, either is preferable to the current set-up.
Chris Davidson
Congratulations to Chris!
For more information, call a Reconnix Consultant on 08454210444 or email us: info@reconnix.com.
What do you think about Zabbix? Do you use Zabbix? Let us know, leave a comment below. 